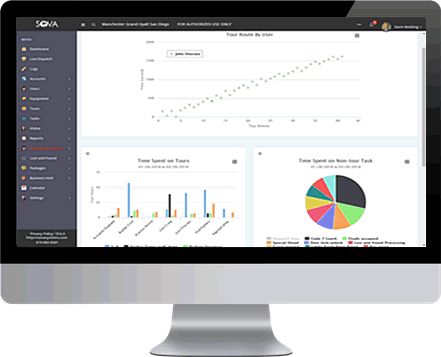
Smart analytics
SOVA presents data in meaningful ways, with charts and graphs which are designed to help you make better business decisions. Answer questions like:
- How much time is spent on non-security related tasks?
- In what sequence are users conducting tours? Are they maintaining randomness in their patrols?
- How much variability do we have in length of time to complete the various tours? Who takes the longest? Who is the fastest?
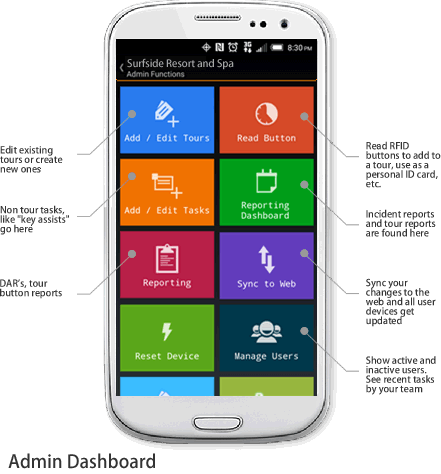
Intelligent Dashboards
The admin dashboard in SOVA allows full management of the security platform from a handheld device running our software. We designed it this way so an admin can make quick decisions without having to be tethered to a desktop PC. Of course, the web application offers the same core capabilities, and adds additional reporting tools that can take advantage of the processing power of a full PC.